Jung Hoon Son, M.D.
Physician-engineer and visual storyteller in medical & healthcare tech — informatics, data visualization, and practical applications of AI. I write about the gap between what models can do and what they actually do.
Selected Work
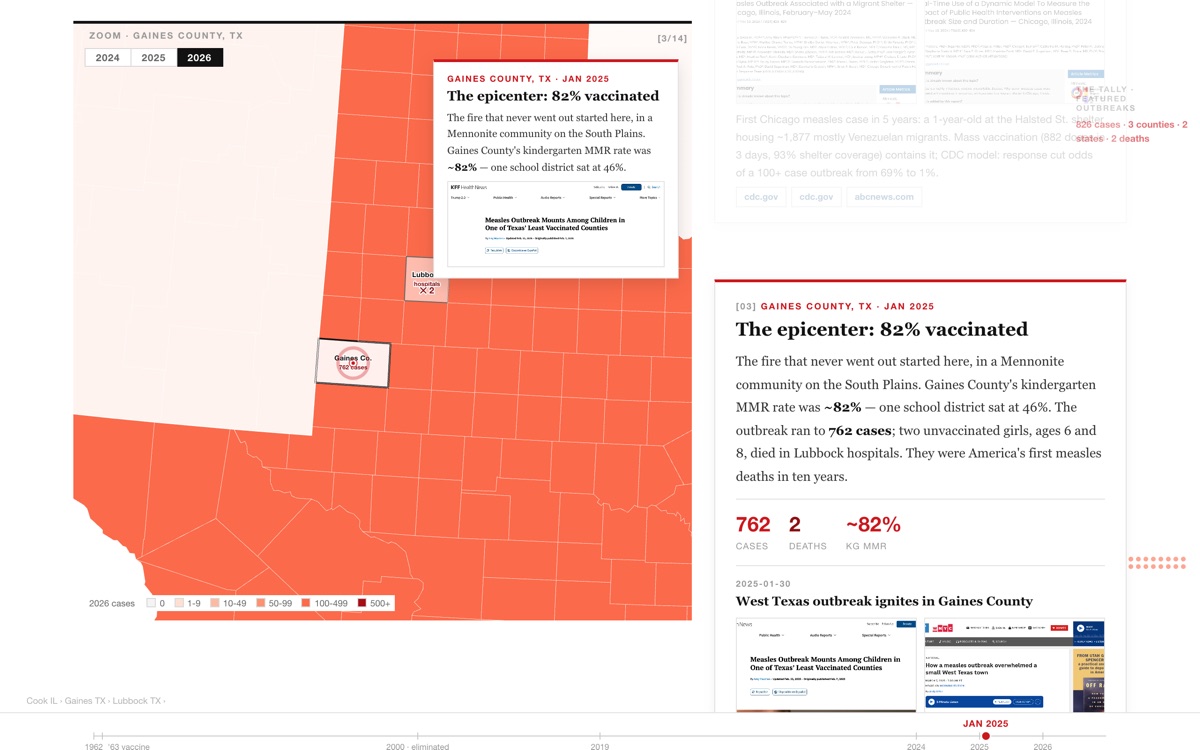
The Year Measles Came Back
Sixty years of measles data, zoomed from national elimination down to the counties and towns where exemptions cluster — a scrollytold map essay in D3.
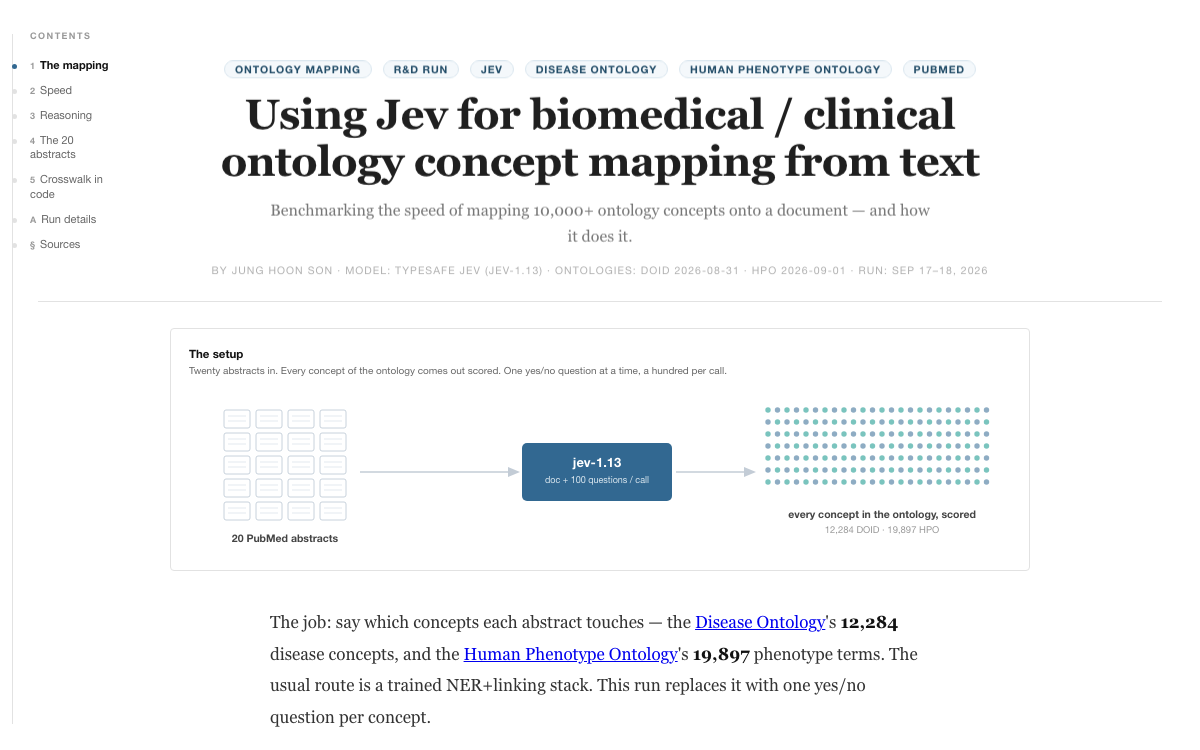
Ontology Concept Mapping with Jev
Every ontology concept as one yes/no question — 643,520 calibrated answers over 20 PubMed abstracts, DOID and HPO, in minutes for pocket change.
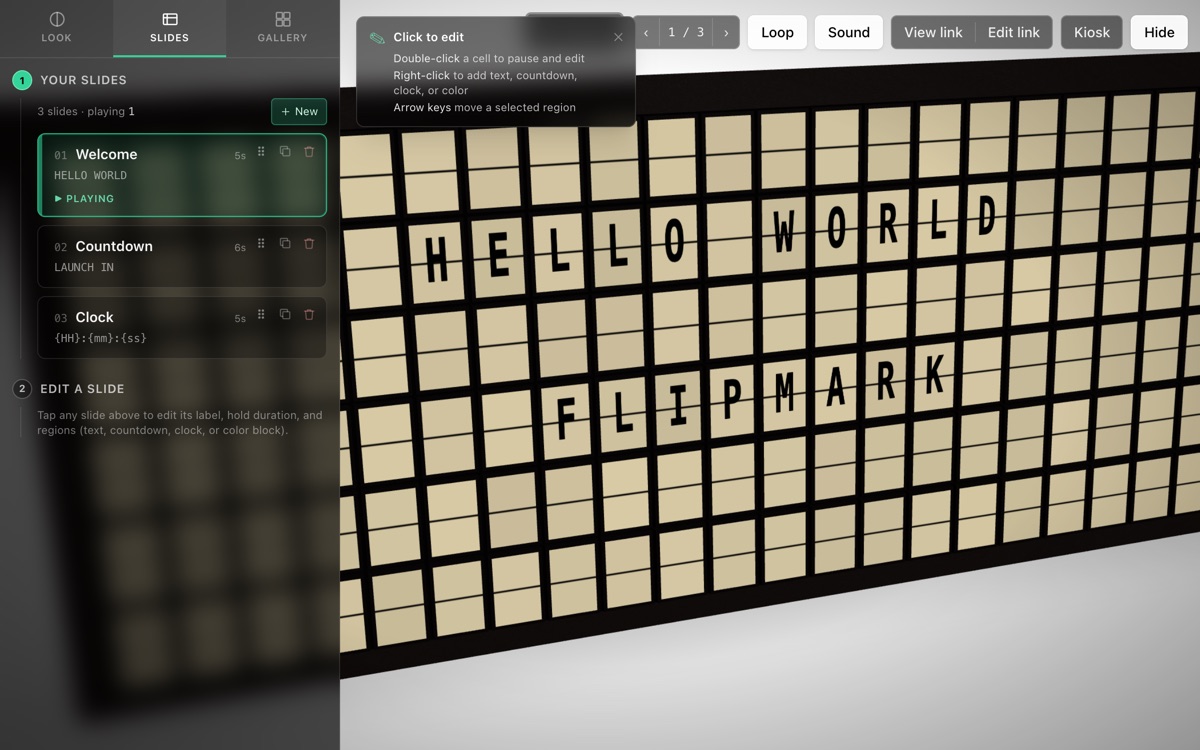
Flipmark
A split-flap (Solari) board you program from the browser — slides of text, countdowns, clocks, and color blocks, with loop, sound, shareable view/edit links, and kiosk mode.
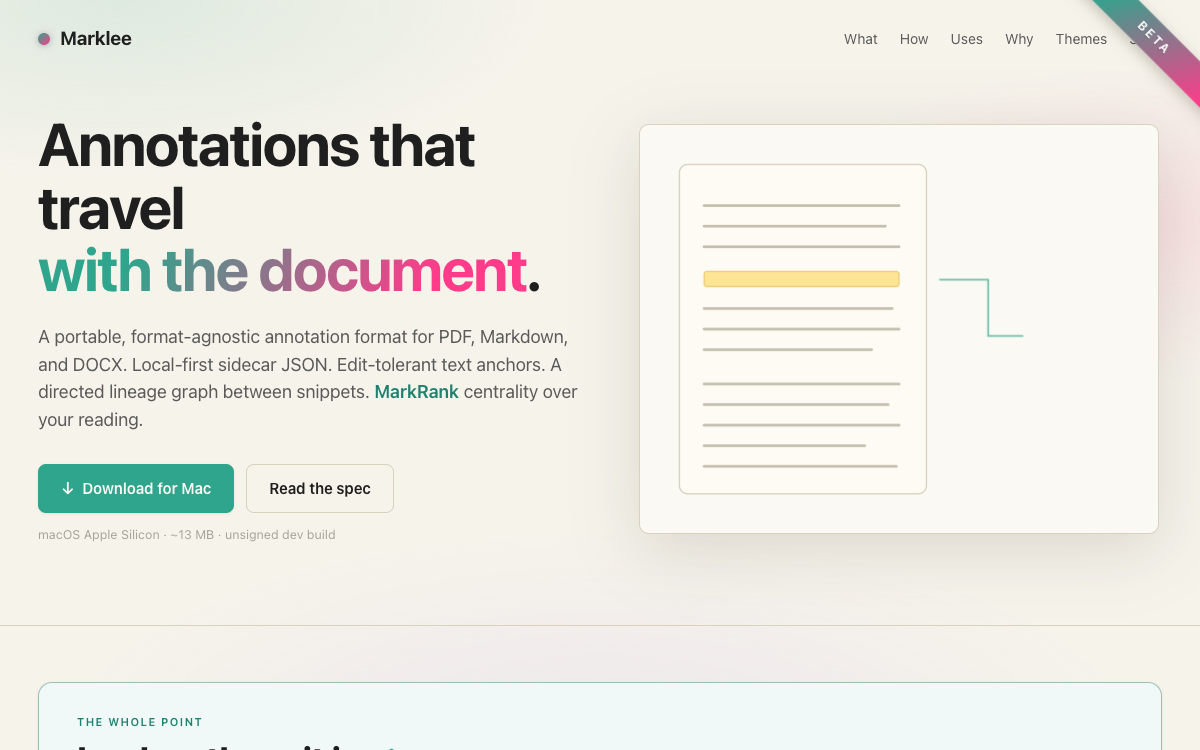
Marklee
Annotations that travel with the document — a portable, format-agnostic annotation format for PDF, Markdown, and DOCX. Local-first sidecar JSON, edit-tolerant text anchors, MarkRank centrality over your reading.
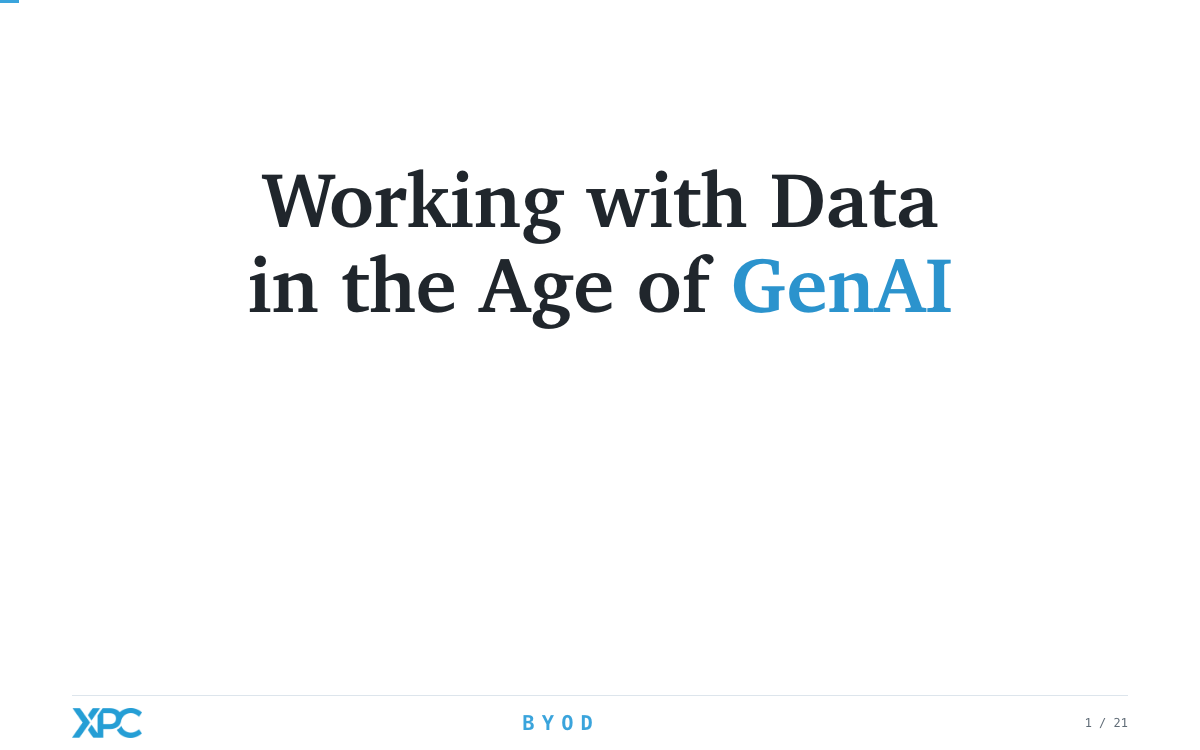
Working with Data in the Age of GenAI
XPC Hackathon winner. A step-through deck on how analytics work changed — imperative → declarative → English — culminating in a prompt typed into a zsh terminal and a styled chart coming out.
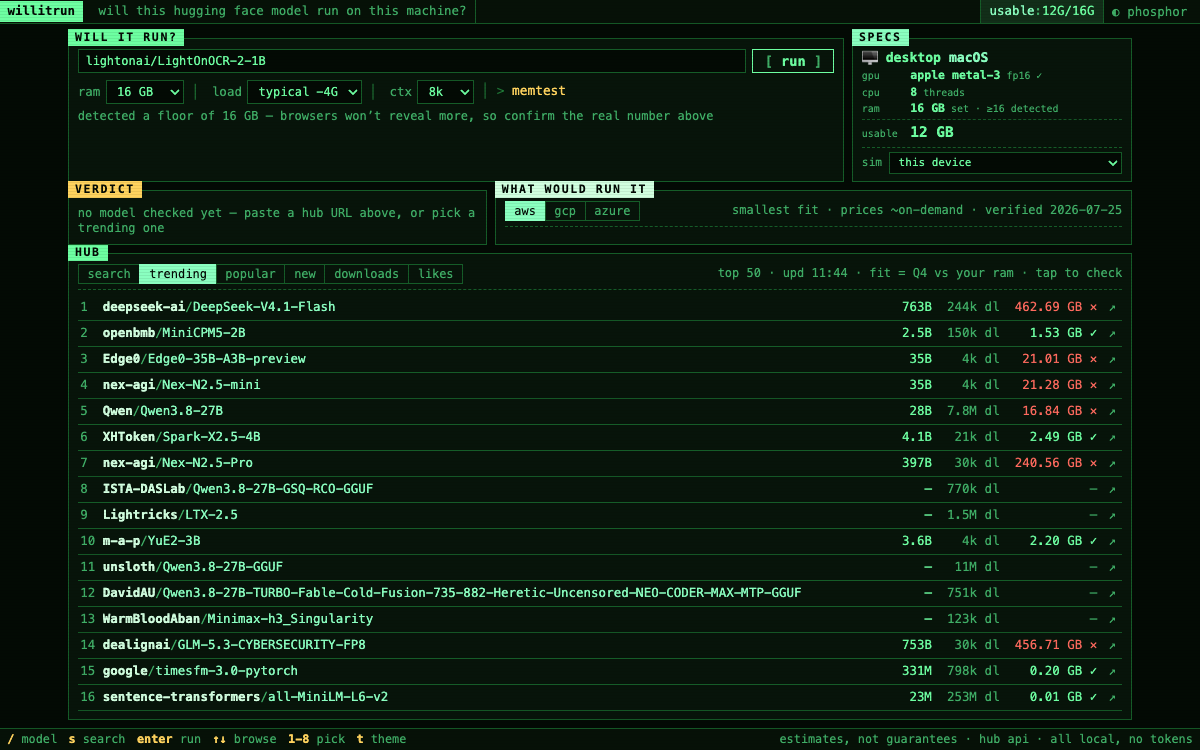
willitrun
Paste a Hugging Face model, find out if the machine you're holding can run it — real parameter counts, KV-cache math, and PASS/TIGHT/FAIL badges in a terminal UI, with a live trending dashboard fit-checked against your RAM.
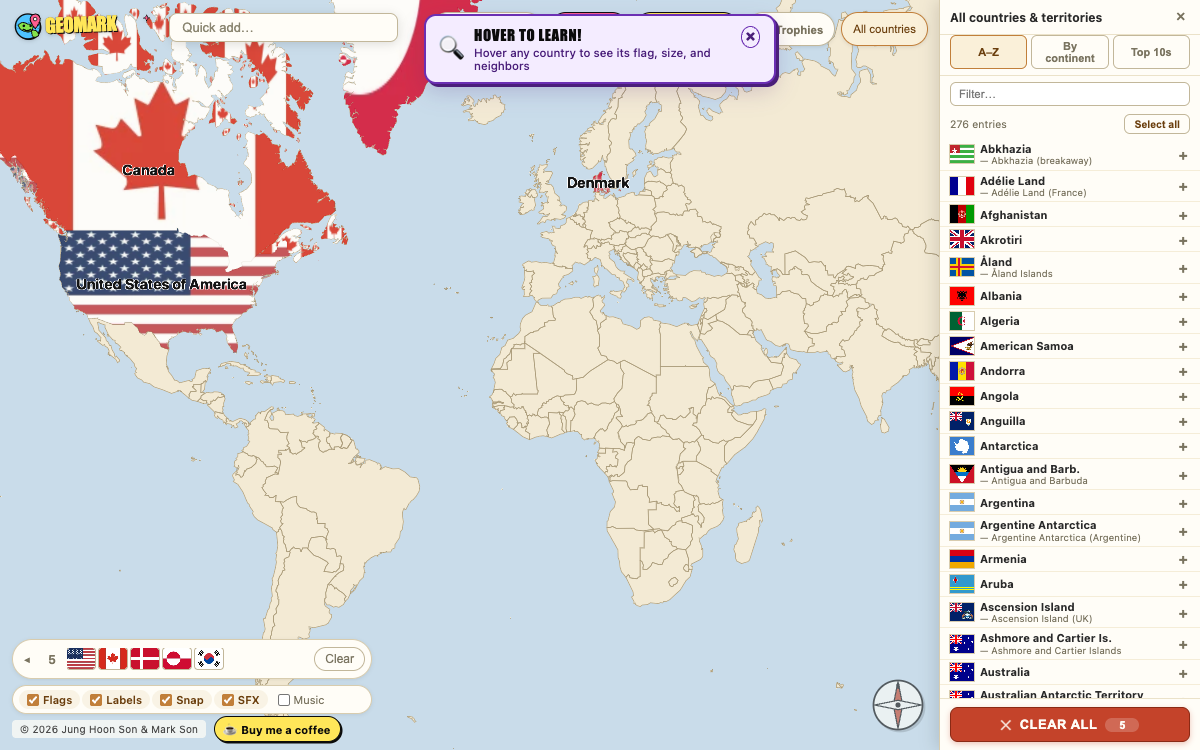
Geomark
A geography quiz game built for my kid — pick countries and watch them fill the map with their flags; hover to learn size, neighbors, and more. Co-authored with Mark Son.
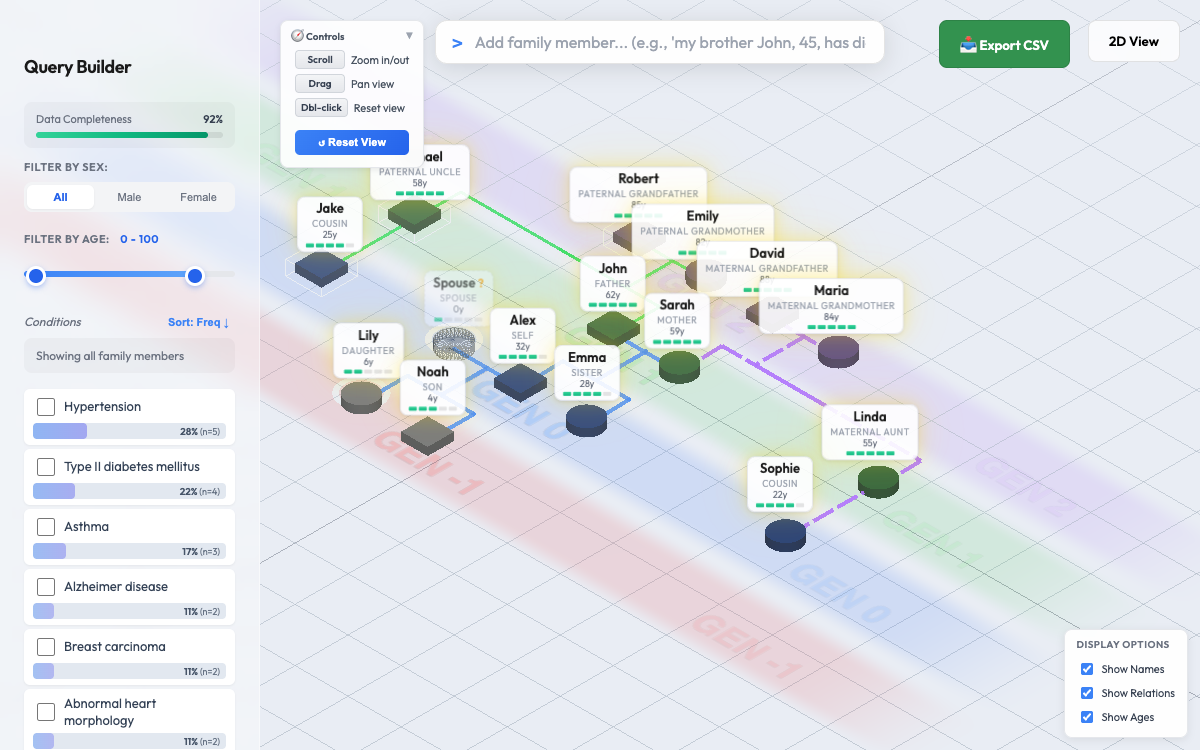
Family History Interface
A structured interface for capturing family medical history.
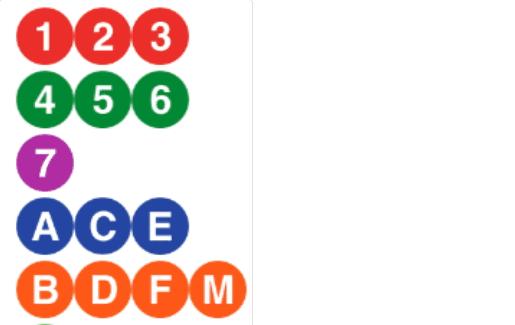
MTA Icon Menu
A subway-line icon menu built entirely in Altair — data-viz as UI, no HTML/CSS — with a wait-assessment analysis of MTA ridership data.